Reports offer valuable comparative analyses based on agents or parameters, helping Auditors, Team Leads, and Managers in their evaluations.
Here's how to access all reports in Convin:
Navigate to the "Home" module.

From the "Overall Dashboard" drop-down menu, choose the "All Reports" option.
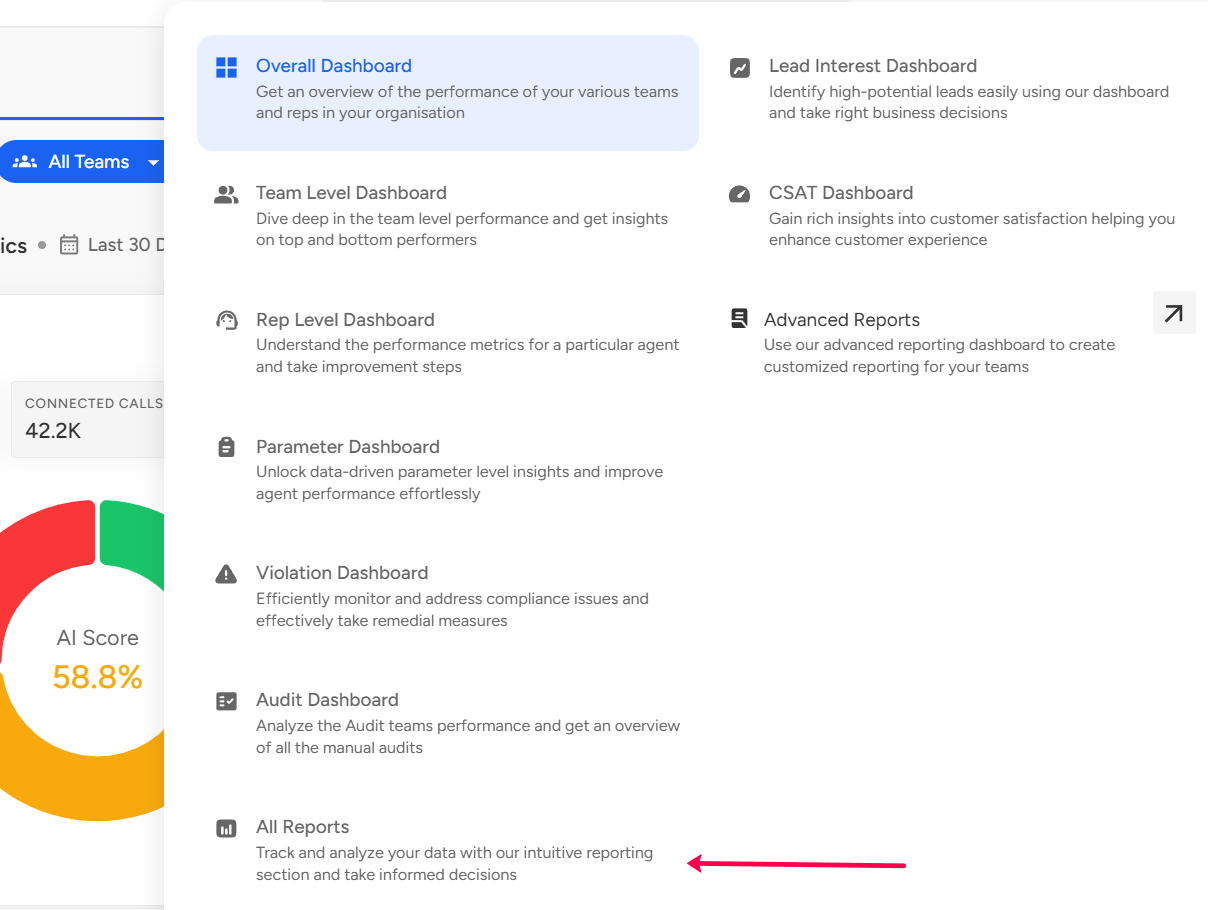
You'll be directed to a page similar to the screenshot below.

Below is the set of reports along with detailed descriptions to ensure everyone can easily grasp the purpose of each report:
Report Name | Overview |
Agent Report | Agent Report provides an overview of how well agents perform during conversations. It breaks down call scoring into percentages for Good, Average, and Need Attention categories. This report helps you see how agents are doing on a specific template across multiple conversations. |
Active Agent Stats | This report represents the team-wise bifurcation of the total active and inactive users. |
Agent Stats report | This report provides agent-wise total conversations connected & analyzed, count of accounts interacted with, and conversation-specific parameters such as interactivity, talk ratio, and duration. |
Best worst parameter report | This report provides the top 5 best parameters that are effectively covered across all the conversations and the bottom 5 parameters where the agents might need further assistance. |
Agent parameter report | This report gives you agent-level parameter occurrence bifurcation to highlight each agent's overall performance on different parameters. |
AI Score month-to-date stats | This report gives you the overall sense of an agent's performance on conversations and the bifurcation between the call scoring in terms of conversations in the Good, Average, and Need categories (Month-to-date stats). It also helps you understand the agent-level performance on a particular template across a set of conversations. To view this report, one needs to select a date range for at most a month. |
Parameter analysis report | The Parameter Analysis report gives you an idea of each parameter occurrence percent for the respective template, and the percent change (showing the incremental or decremental trend based on the previous period of the selected date range). |
Violation analysis report | This report gives you agent-wise data on the number of violations that occurred for the parameters marked as violations and gives a defect percentage for each of them. |
Lead analysis report | This report reflects the agent-wise, count of the total conversations in the category of Hot, Warm, and Cold, respectively. |
Lead dashboard report | This report provides you with agent-wise, and account-wise raw dump with crucial information such as first call/ last call attempt date, count of total conversations attempted to the particular account, and Lead score analysis. |
Team Analysis Report | This report provides you with the team-wise bifurcation of good conversations, average conversations, and bad conversations. It also includes average conversation scores, conversation-specific parameters, and percent change in the trend of each of the metrics. |
Parameter Defect Analysis Report | This report provides the defect percent for each parameter across the respective audit template. |
Email Analysis Report | This report provides an agent-wise count of emails sent and the overall open rate. |
Sub-parameter analysis report | This report provides the occurrence percentage of each sub-parameter within parameters, thus providing more granular bifurcation. |
Team parameter comparison report | This report provides you with a team-on-team comparison of the occurrence percentage of various parameters. This report allows you to identify teams that cover relevant parameters effectively and teams that require assistance. |
Parameter Pareto report | This report highlights which are the 20% of parameters that are contributing to 80% of the errors in your quality parameter score. |
Agent Pareto report | This report highlights which are the 20% of the agents that are contributing to 80% of the errors in your quality parameter score. |
Customer intelligence agent-wise report | This report provides you, agent-wise, with how many times a particular phrase occurred across the set of analyzed conversations along with the conversation count. |
Customer intelligence phrase-wise report | This report highlights how often a particular phrase occurs across the set of analyzed conversations, along with the conversation count. |
Parameter comparison report | This report provides parameter-wise average scores when audited via Convin.ai and when audited manually, respectively. |
Parameter detailed analysis report | This report shows agent-wise how well the parameters are covered across respective agents’ conversations. One can identify effectively covered parameters and parameters where the agent might need further assistance. |
Agent comparison report | This report shares agent-wise, both of the average conversation scores when the conversations are audited via AI and Manual, respectively. |
Team comparison report | This report shares team-wise, the average conversation score when the conversations are audited via AI and Manual, respectively. |
Short connected conversations report | This report provides us with the count of short-connected (short-connected calls threshold is less than or equal to 180 secs) conversations agent-wise, in date-wise format. |
Category analysis reports | This report provides category-wise average - score percent (score is calculated as the overall score obtained for a category/ total score of the category) and the respective trend percent (whether the trend is incremental or incremental). |
Agent performance report | This report provides agent-wise total conversations analyzed and the average conversation score. |
📩 Still need help? Contact our support team at [email protected] —we’re happy to assist!
Good day!