Using the Lead Interest Dashboard, you can analyze lead engagement patterns to understand the likelihood of conversion for each account. This dashboard provides insights into overall lead distribution, interest classification, and agent-wise performance—helping you identify potential opportunities and optimize sales strategies.
To access the Lead Interest dashboard, follow the below steps:
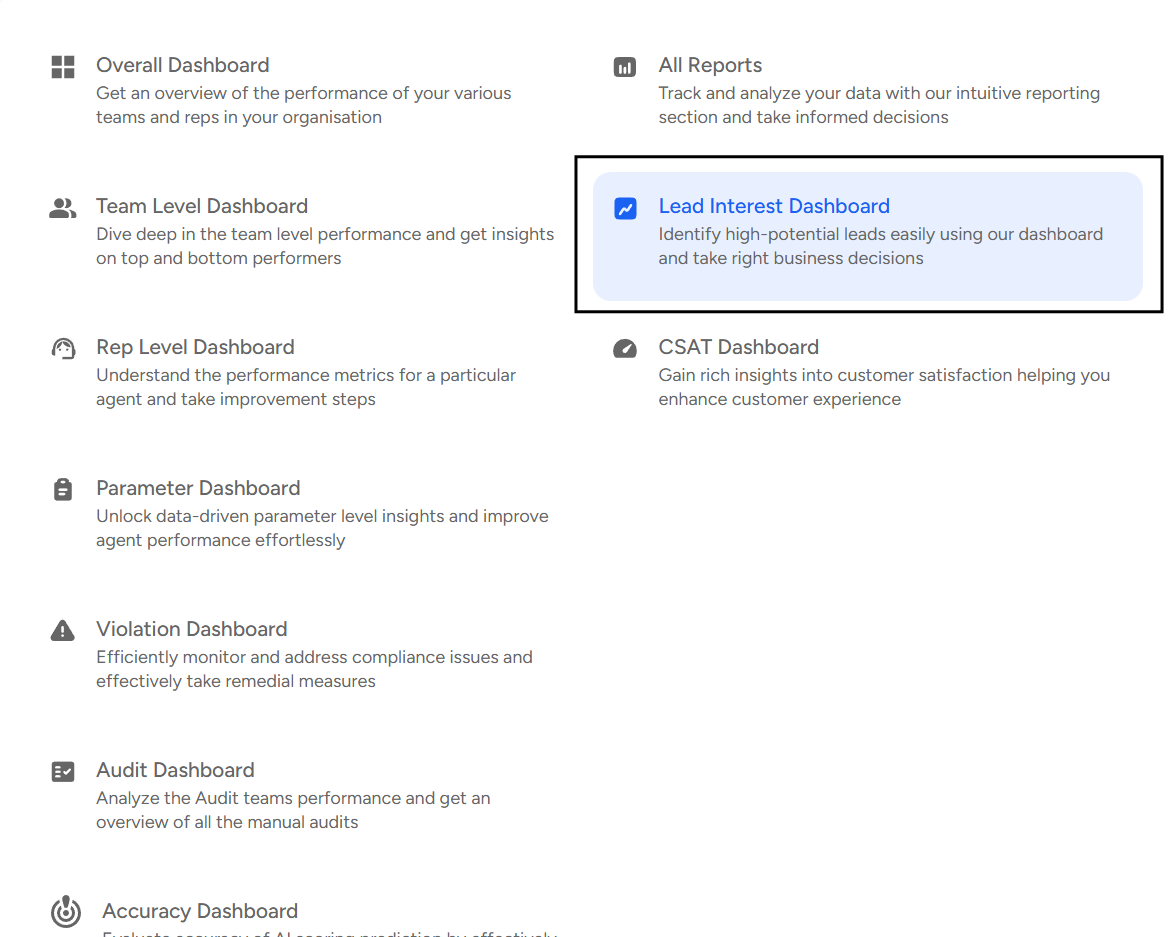
- Navigate to the Home Page.

- Under the "Overall Dashboard" drop-down, select "Lead Interest Dashboard".
- Apply Filters
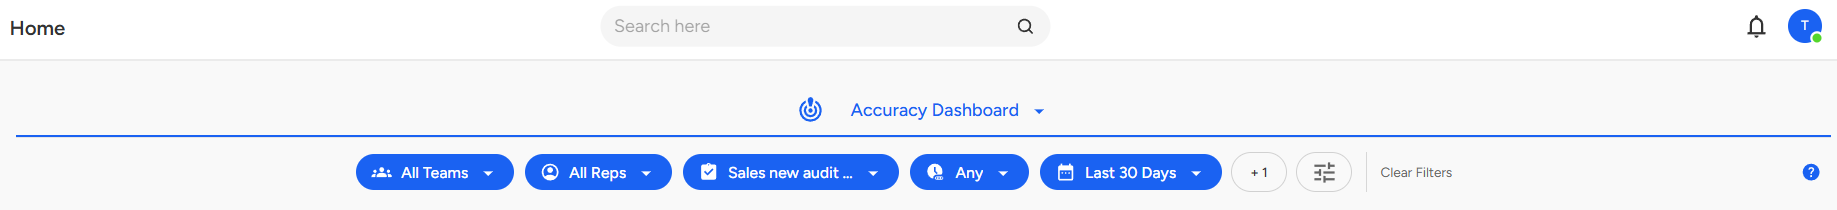
Use the Filters panel to customize your view by selecting specific teams or agents, choosing a date range, and applying additional filters such as Audit Type, Tags, or Status to refine and focus your lead interest analysis.
Lead Interest Dashboard Provides the Following Insights:
- Overall Analytics:
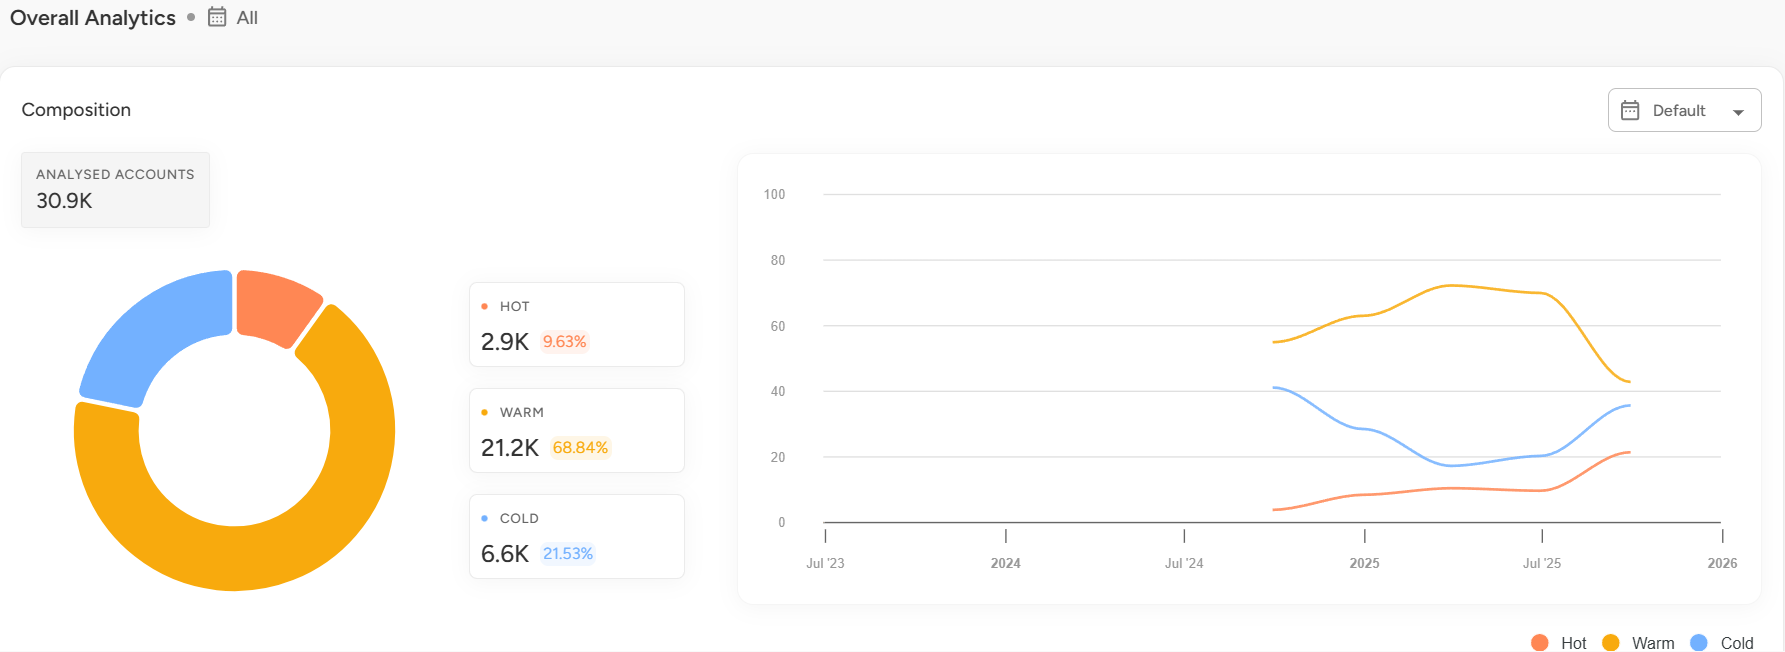
Shows the total number of analyzed accounts and categorizes leads into Hot, Warm, and Cold based on engagement level. Also includes a graphical view of lead distribution for the selected filters. - Reports:
- Lead Analysis Report:
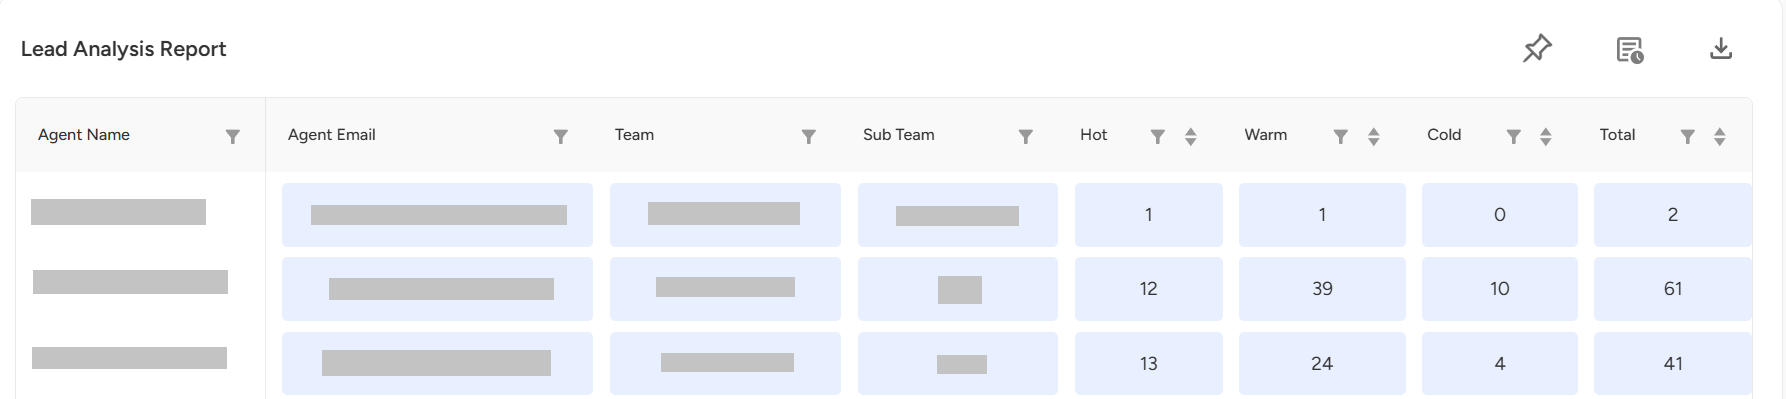
Provides an agent-wise and age-based breakdown of Hot, Warm, and Cold leads to evaluate team performance and engagement trends. - Lead Dashboard Report:
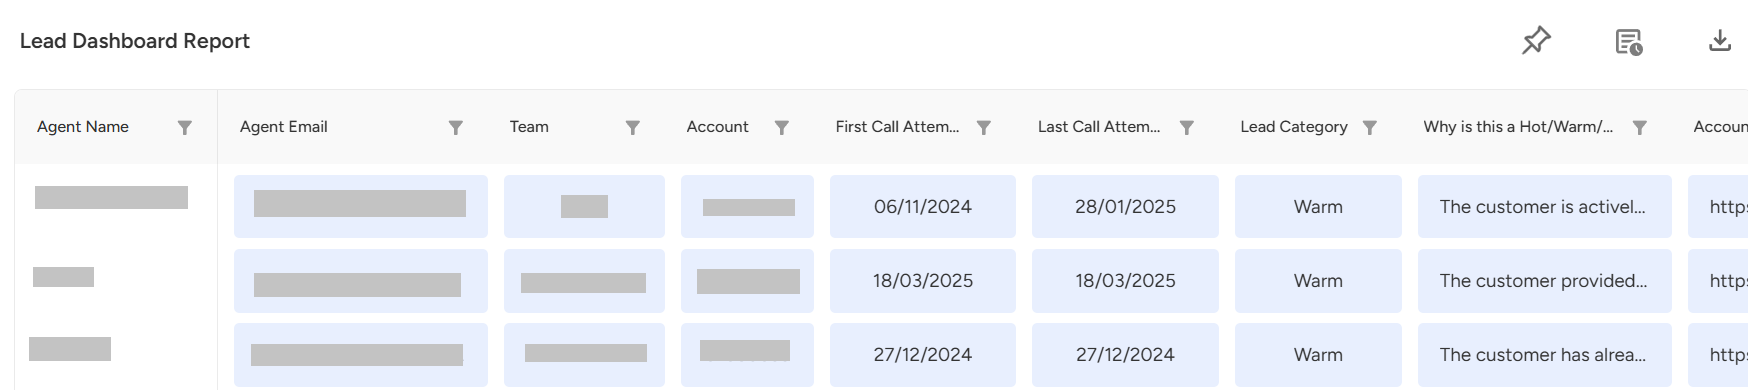
Offers an account-level view with lead categorization, reasoning, and contact details to understand lead behavior and conversion potential.
📩 Still need help? Contact our support team at [email protected] —we’re happy to assist!
Good day!