Through Violation Dashboard, one have the capability to oversee the performance of individual agents or teams on a broader scale through diverse formats. This dashboard furnishes statistics regarding the coverage of each violation within analyzed calls, delivering valuable insights alongside information about team composition.
To access the violation dashboard, follow the below steps:
Navigate to the "Home" module in the Convin platform.
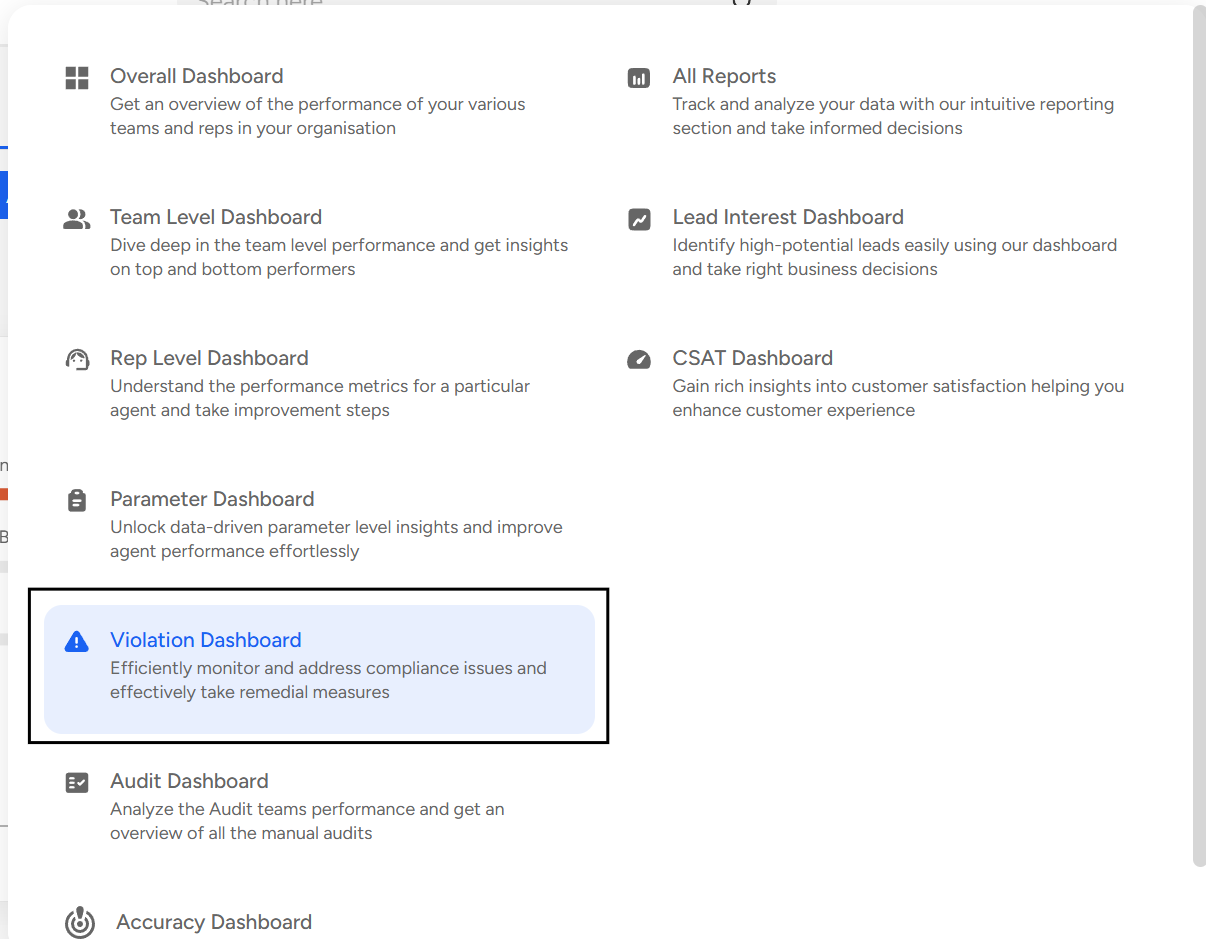
Under the "Overall Dashboard" drop-down, select "Violation Dashboard".
Violation Dashboard gives the following insights:
Violations:
Violation Occurrence
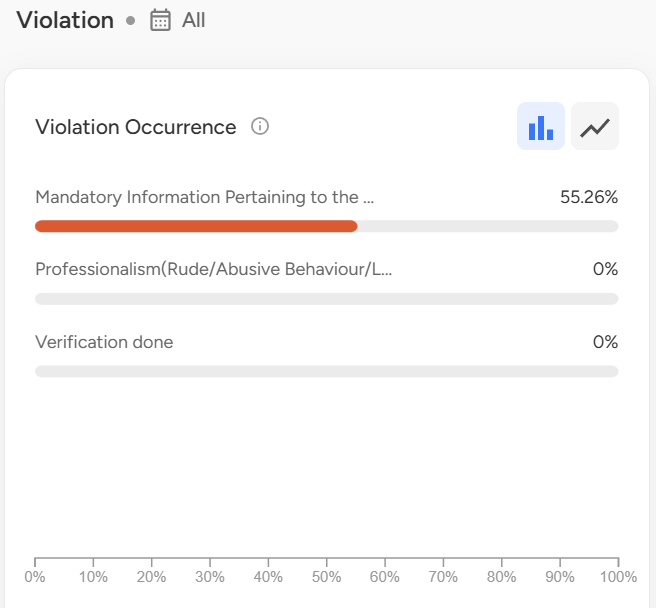
Team Composition - The composition of the team is depicted on a scale, illustrating the percentage of violation attributed to each team.
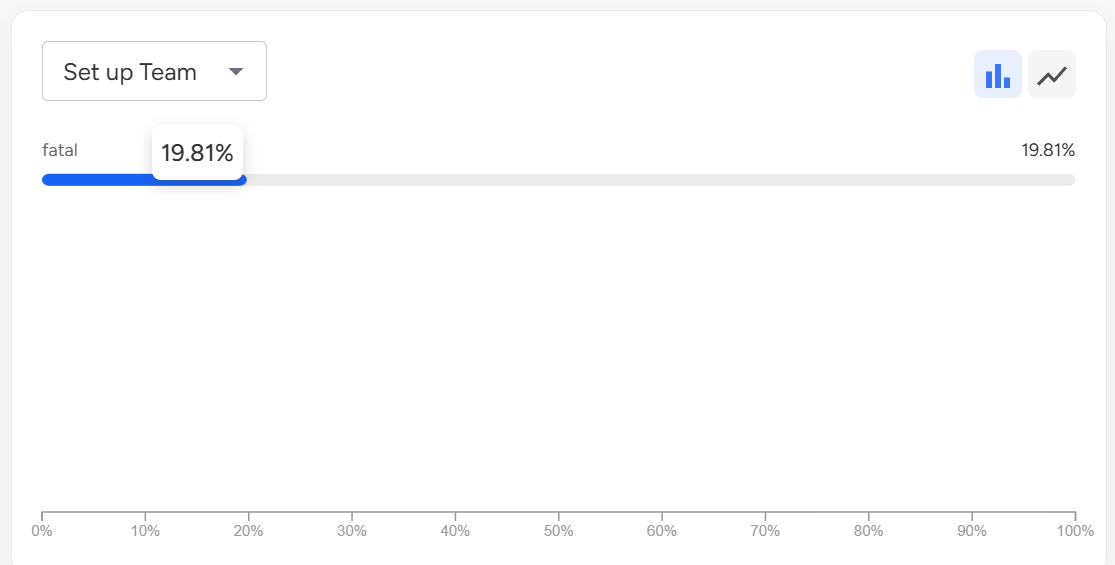
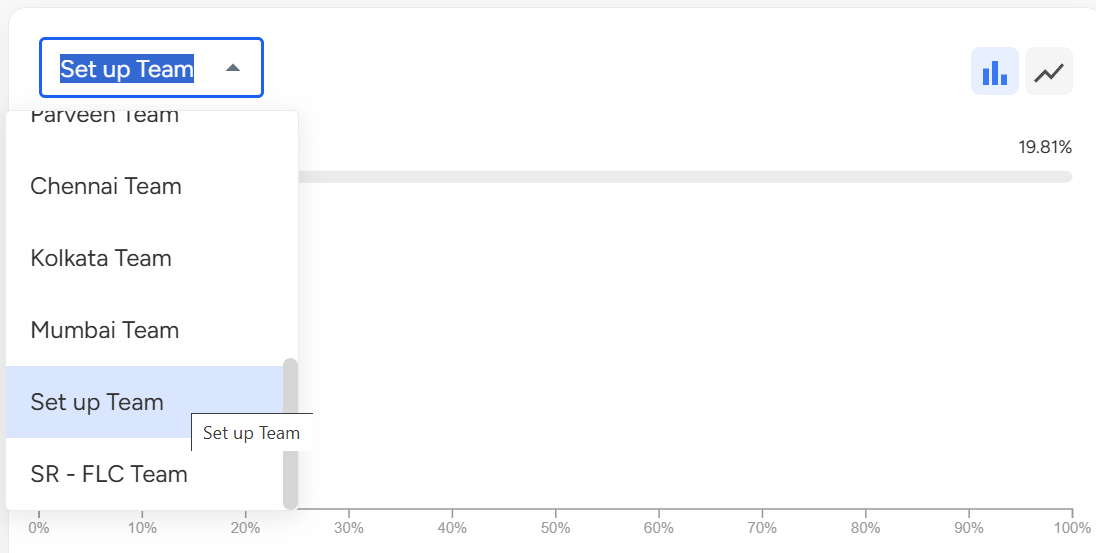
Violation w.r.t a particular team - On this card, you have the option to choose a specific team from the provided dropdown menu. Once you select a team, a set of violations will be presented on a percentage scale corresponding to the chosen team.
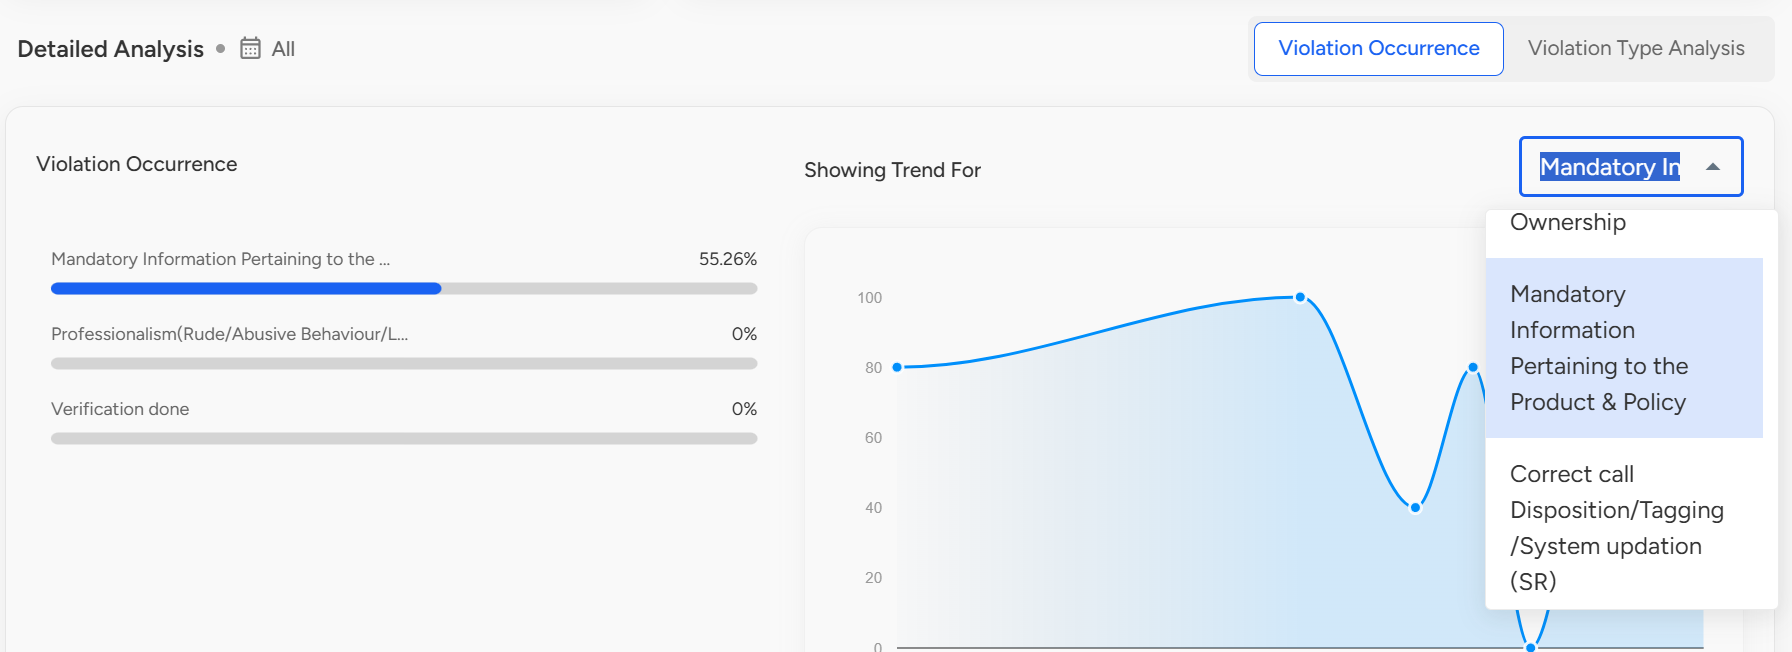
Detailed Analysis:
Violation Occurrence - In this context, you have the ability to analyze trends by filtering based on parameters.
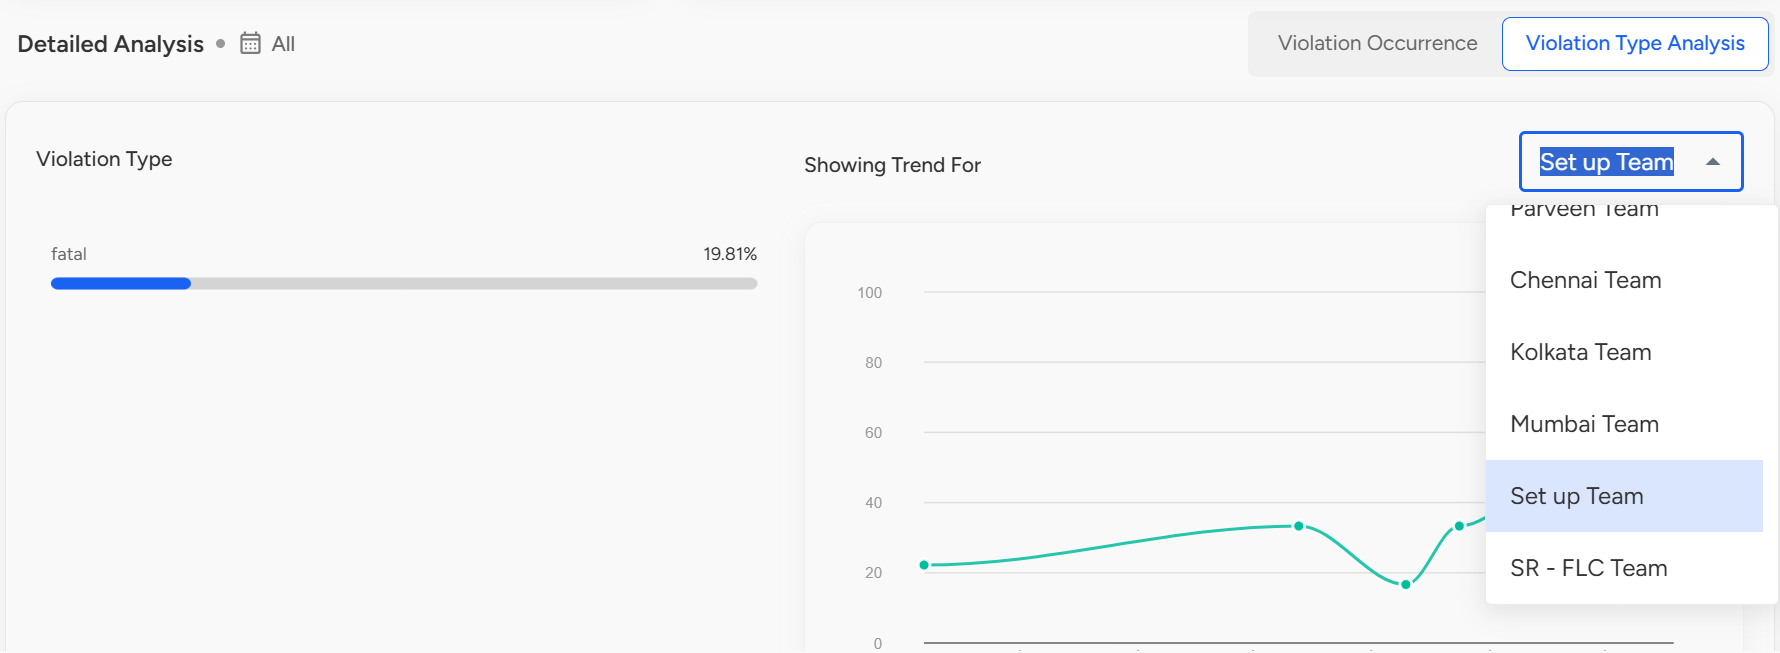
Violation Type Analysis - When conducting violation type analysis, trends can be filtered based on the team.
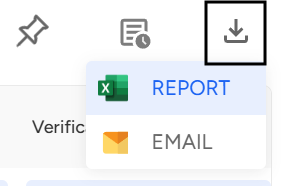
Violation Analysis Report: This report provides a detailed analysis, indicating the percentage of violations that have occurred for each agent. You can pin the report for quick access, schedule it for automatic delivery at regular intervals.
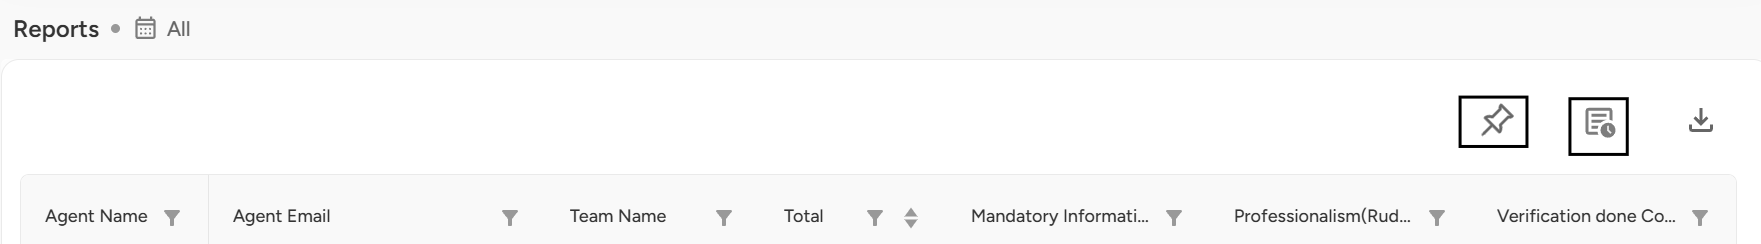
One can download the report in their desired format, by clicking on the download icon.
📩 Still need help? Contact our support team at [email protected] —we’re happy to assist!
Good day!