Bubble View provides a visual representation of insights, where each bubble represents a unique conversation driver or category. The size of each bubble reflects its frequency or impact, helping users quickly identify key patterns and high-priority insights across conversations.
How to Use Bubble View in Convin (Customer Intelligence):
- Navigate to the Convin Insights module.
- Select the Customer Intelligence page.

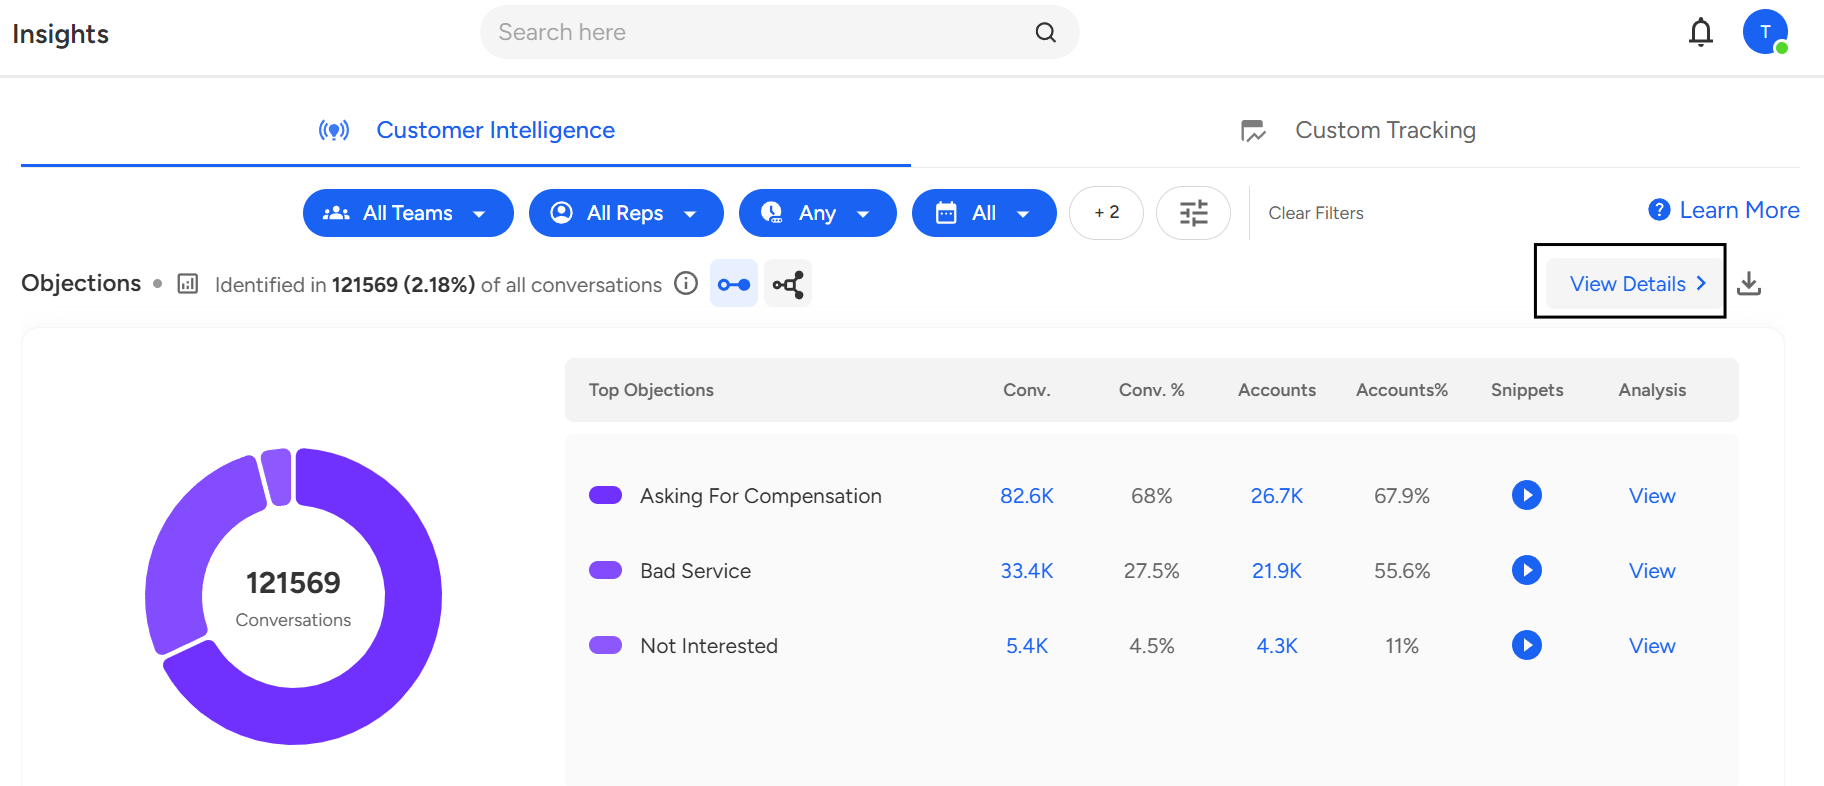
- Use the Filters section to customize your analysis.

You can filter data based on parameters such as Team, Agent, Date Range, Duration, or other available fields. - Click on View Details.
- In the detailed view, click on the Bubble View icon at the top of the page.
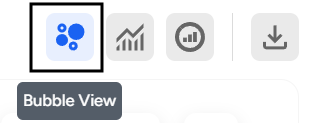
- Once you switch to Bubble View, an overview page will appear displaying bubbles that represent different insights or conversation categories.
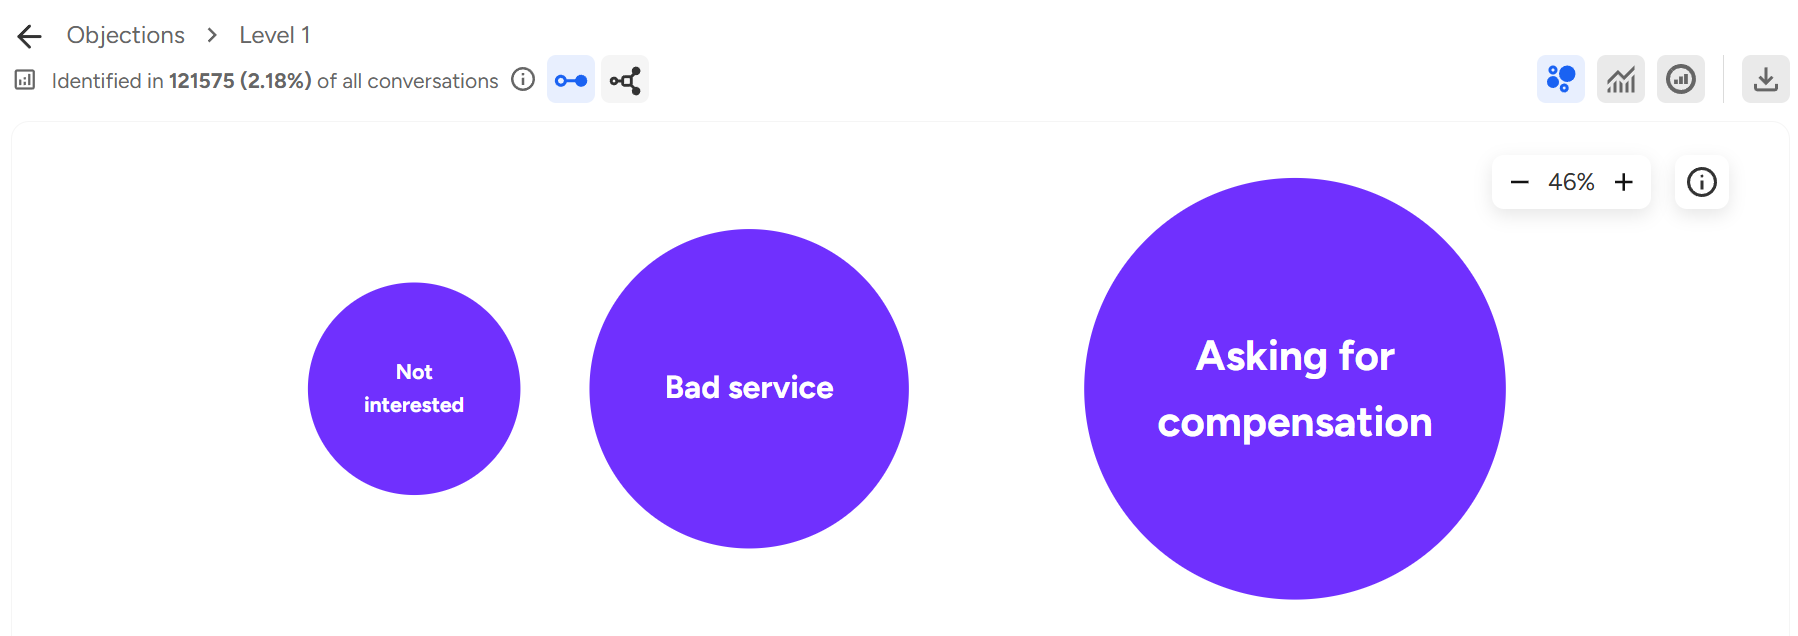
The size of each bubble indicates the frequency or impact of that particular insight. - Click on Any Bubble:
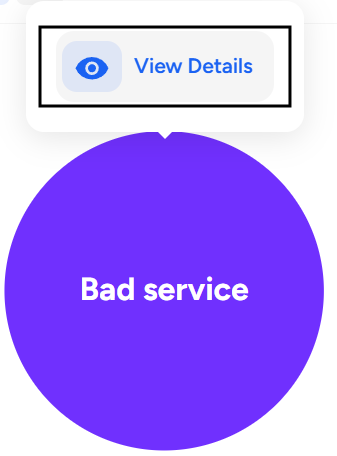
The View Details section will appear, showing the associated insights and metrics. - After clicking View Details, a detailed analysis overview will open.
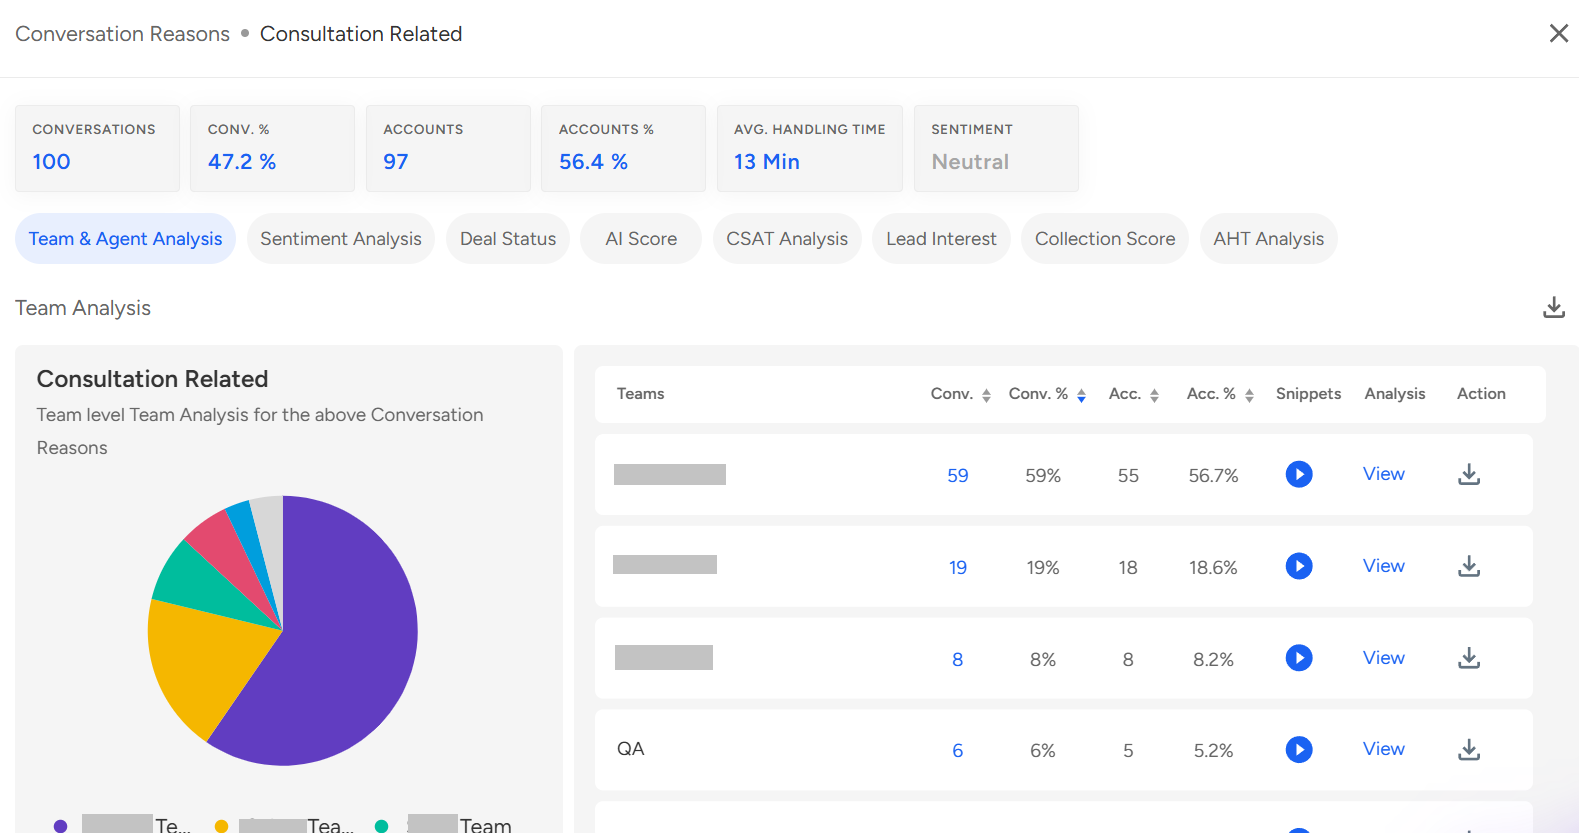
Here, you will be able to view the detailed analysis, including key metrics and associated conversations for the selected insight.
📩 Still need help? Contact our support team at [email protected]—we’re happy to assist!
Good day!