Trend View provides a visual representation of conversation insights over time, where each line represents a unique conversation reason or category. It helps users track patterns, compare trends, and identify shifts in customer interactions across selected time periods.
How to Use Trend View in Convin (Customer Intelligence):
- Navigate to the Convin Insights module.
- Select the Customer Intelligence page.

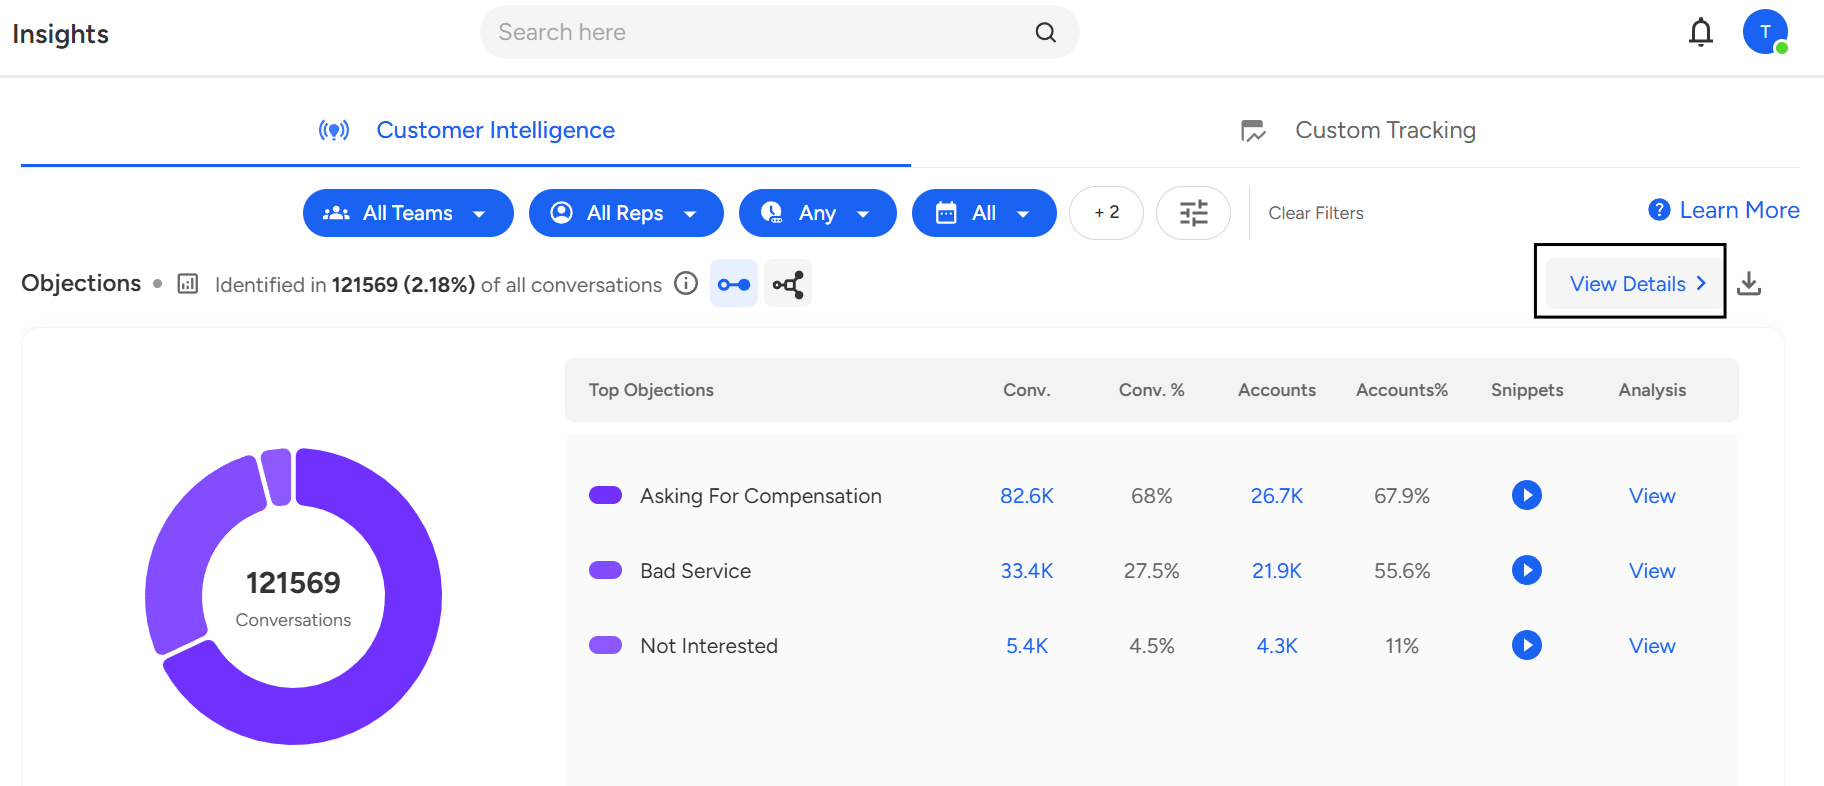
- Use the Filters section to customize your analysis.

You can filter data based on parameters such as Team, Agent, Date Range, Duration, or other available fields. - Click on View Details.
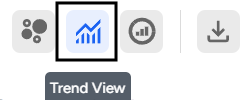
- In the detailed view, click on the Trend View icon at the top of the page.
- Once switched, the Trend View will display a line graph showing the performance of multiple conversation reasons over time.
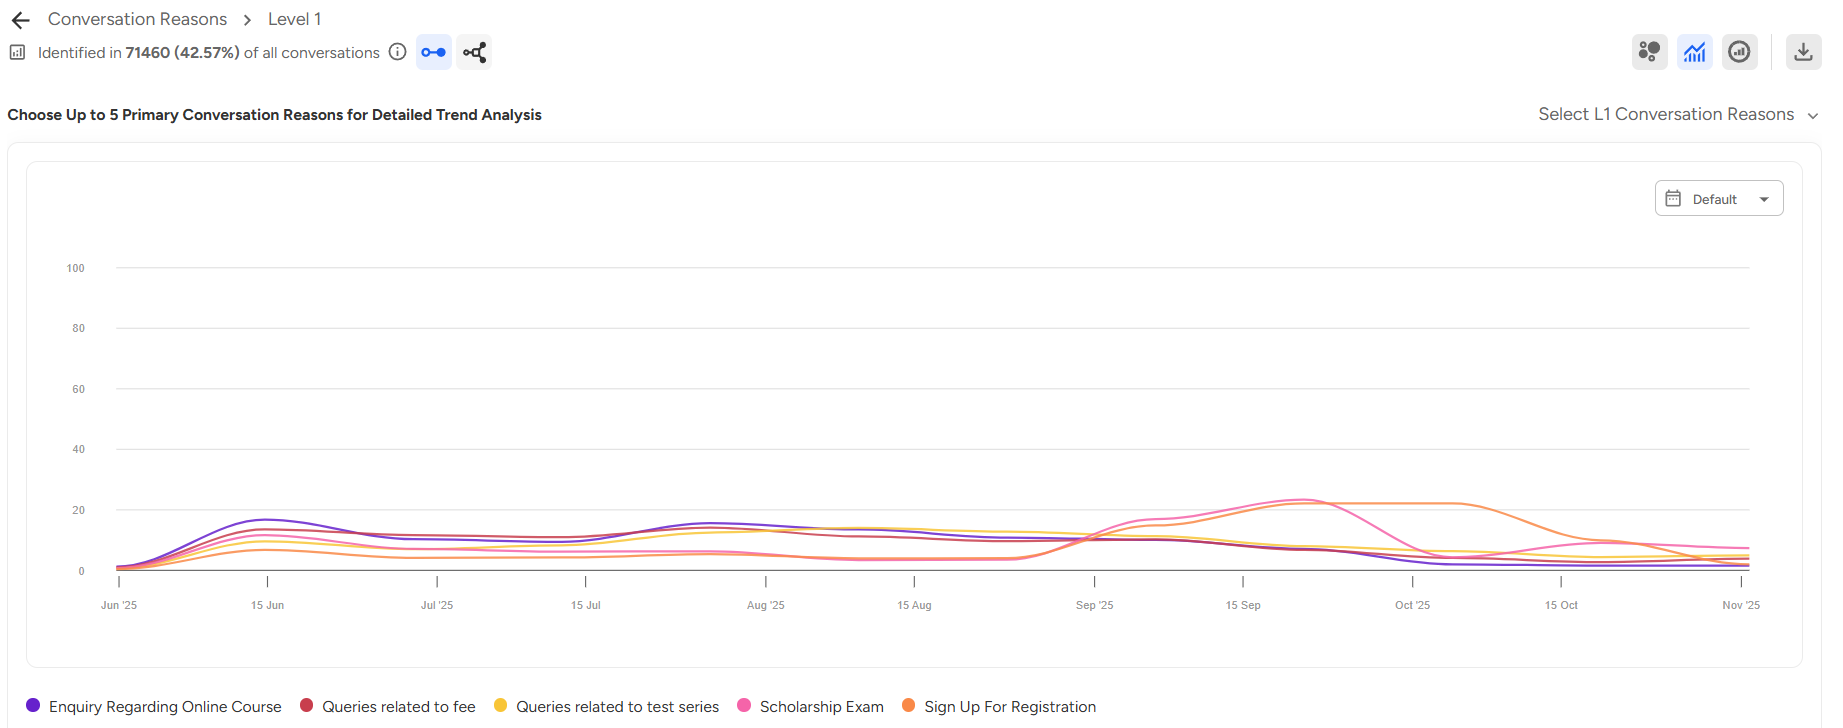
Each line on the graph represents a unique conversation reason or category. - Select Conversation Reasons:
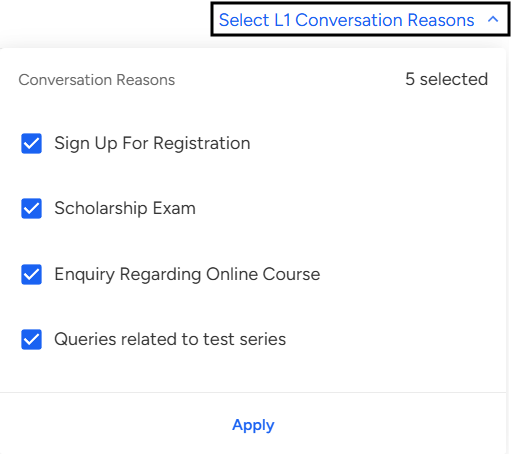 By default, five conversation reasons will appear on the graph. You can customize the view by selecting any five conversation reasons as per your requirement to focus on specific insights or topics.
 - Choose Date Range:
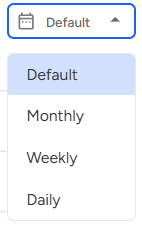
You can view data monthly, weekly, or daily, depending on how you wish to analyze changes and performance over time.
📩 Still need help? Contact our support team at [email protected]—we’re happy to assist!
Good day!