The Graphical and Layout View in Custom Tracking helps you visually understand how your tracked keywords and groups are performing. Instead of manually reviewing conversations, this view presents clear charts and organized layouts that show trends, frequency, and distribution of tracked terms—making analysis faster and more intuitive.
Steps to Access the Graphical & Layout View for a Group:
- Navigate to Convin Insights Page:
- Select Custom Tracking Page.

- Select the Desired Group.
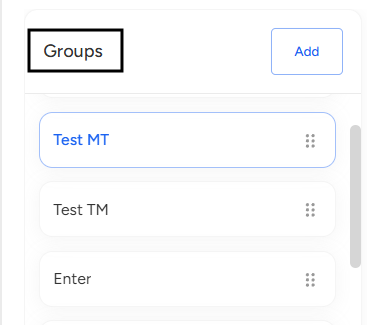
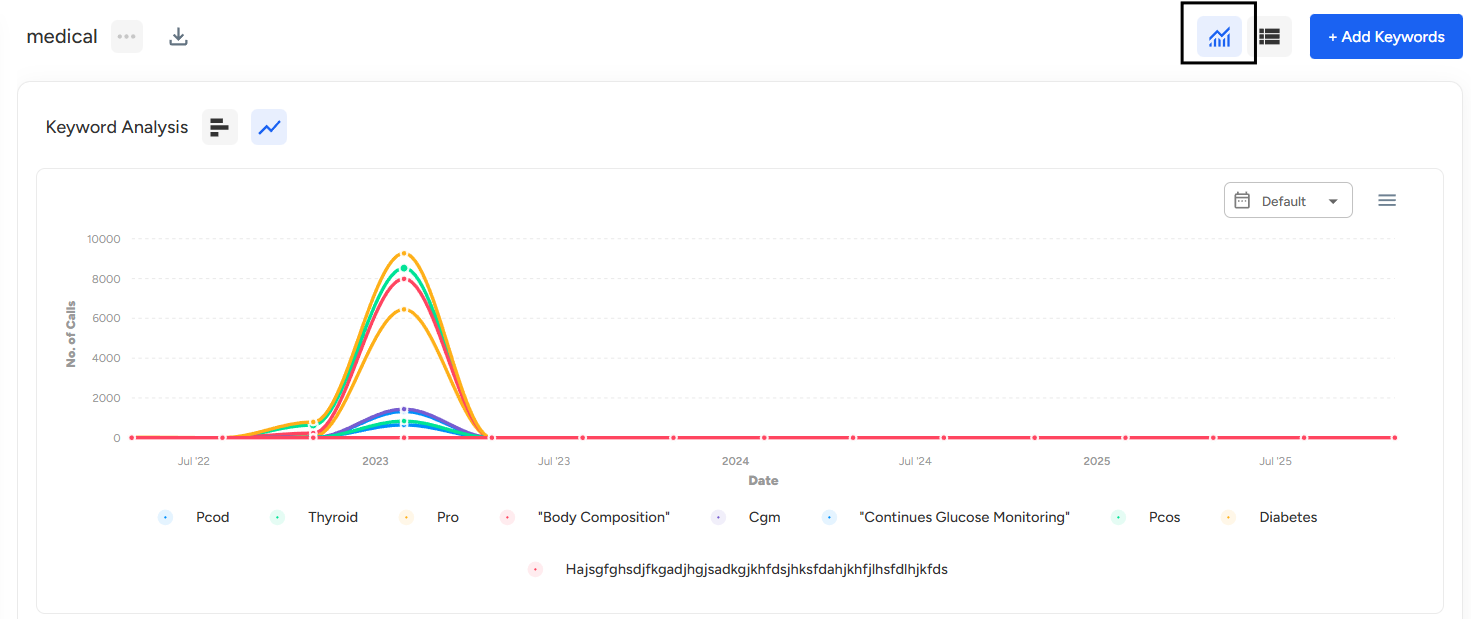
Locate the Group you want to analyze and click on it. - Click on the Graphical icon at the top to view the group in Graphical View.
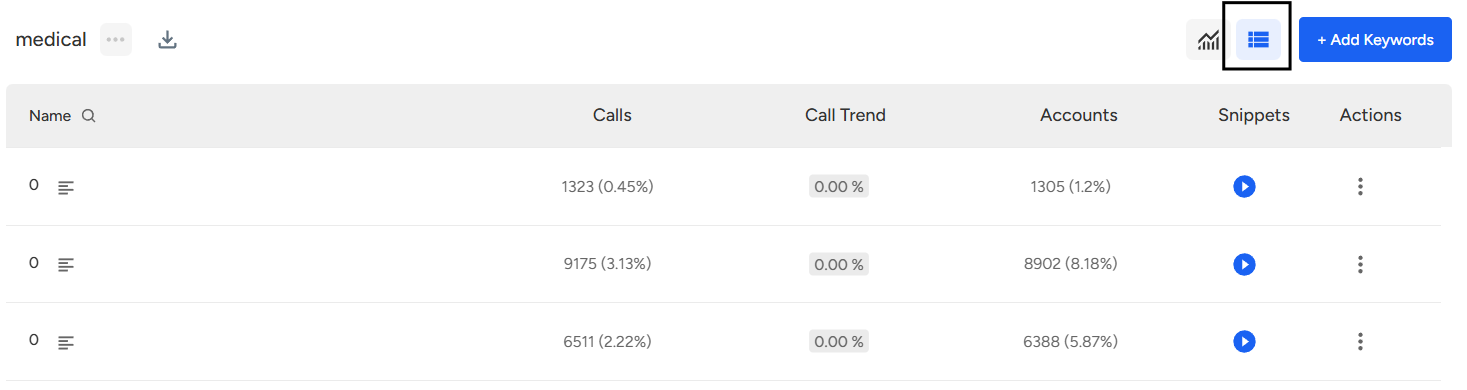
- Click on the Layout icon next to it to switch the group to Layout View.
📩 Still need help? Contact our support team at [email protected] —we’re happy to assist!
Good day!