The View Analytics feature in Convin Sense provides a comprehensive view of campaign performance by showcasing key metrics related to lead outcomes, engagement activities, and overall spend. It enables users to monitor campaign effectiveness, analyze trends, and make data-driven decisions to optimize performance.
Steps to View Campaign Analytics:
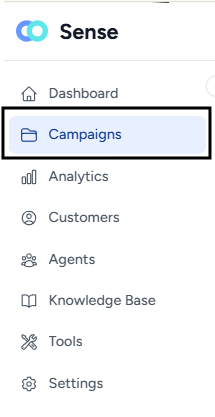
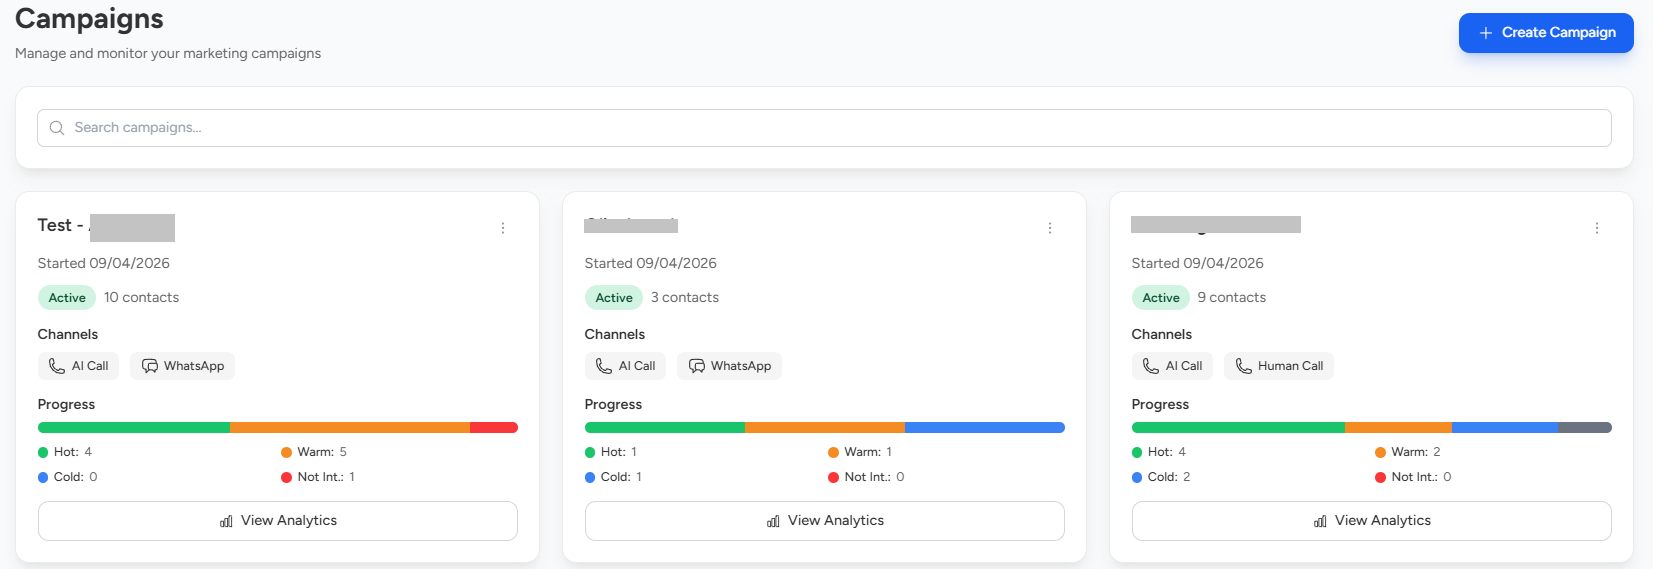
- Navigate to the Campaigns page.
- Locate the campaign for which you want to view analytics.
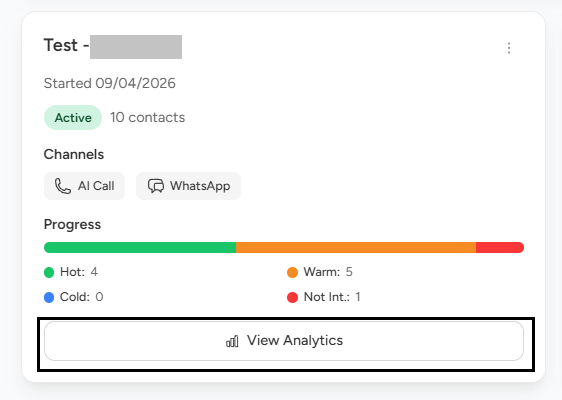
- Click on View Analytics.
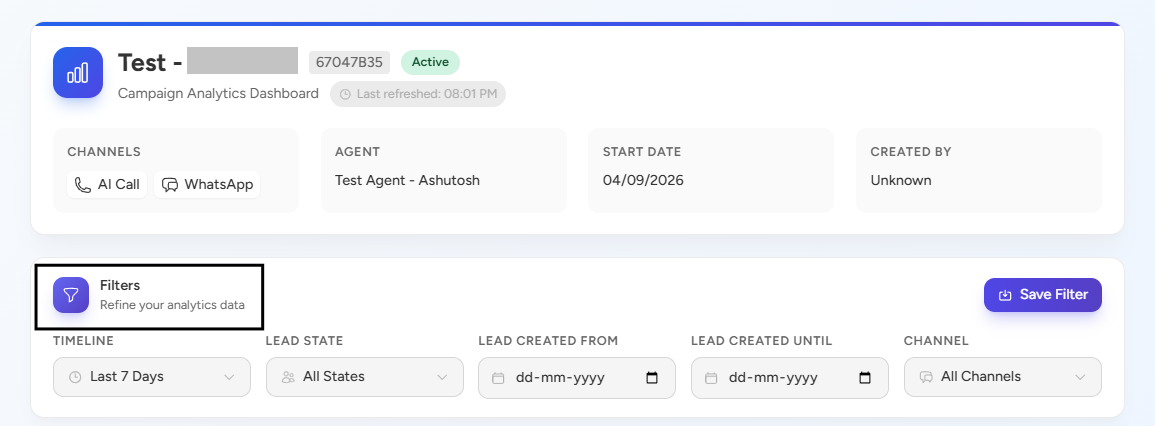
- Once opened, you can view campaign details and apply filters as needed to refine the data.
Analytics Sections
Campaign analytics is divided into three sections:
1. Outcome: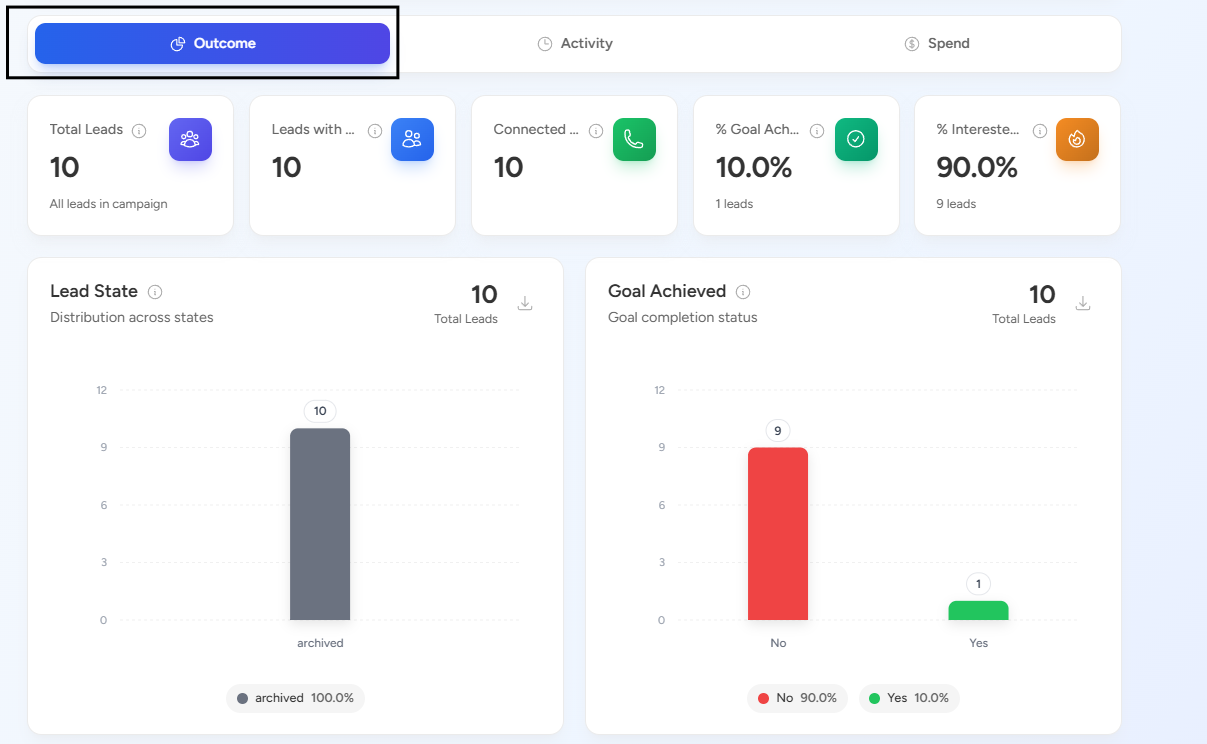
This section provides a summary of lead performance:
- Total Leads
- Lead State
- Goal Achieved
- Lead Qualification Status
- Lead Interest Status
You can also download reports from this section.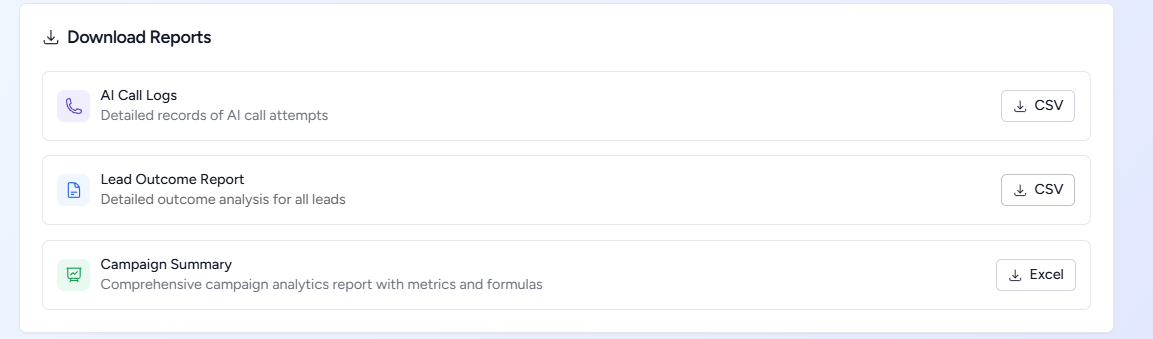
2. Activity: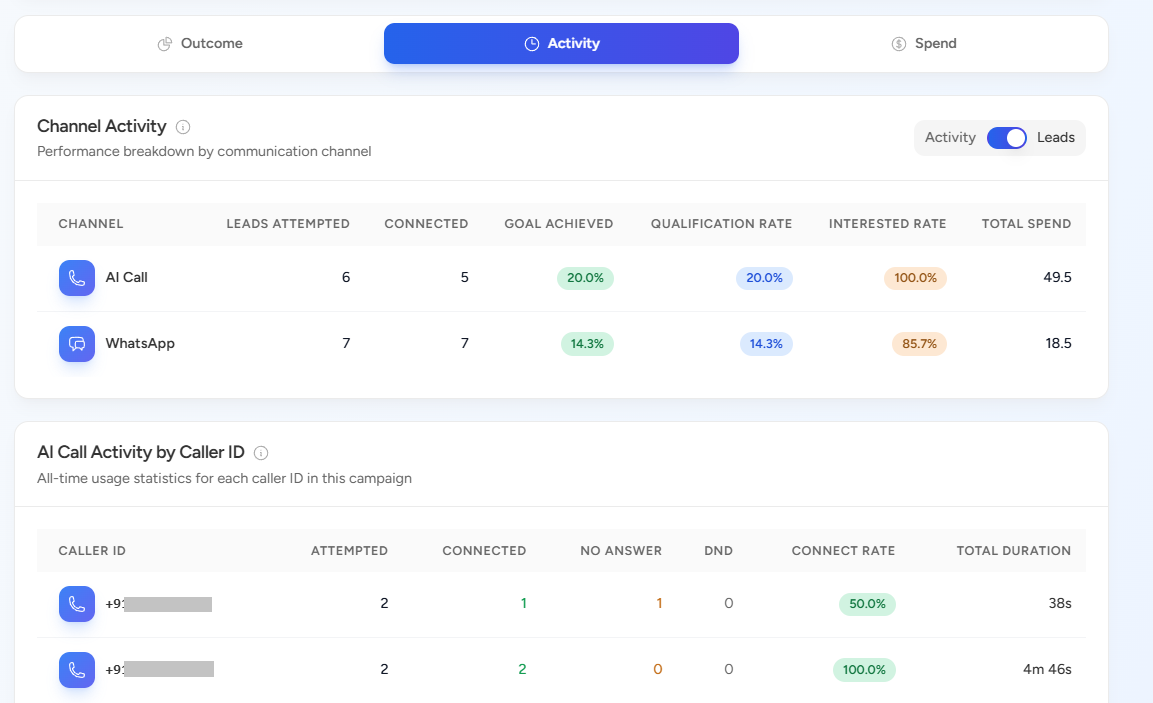
This section shows engagement and interaction insights:
- Channel Activity
- AI Call Activity by Caller ID
- Best Time to Connect (Weekly Pattern)
- WhatsApp Analytics
Reports can also be downloaded from this section.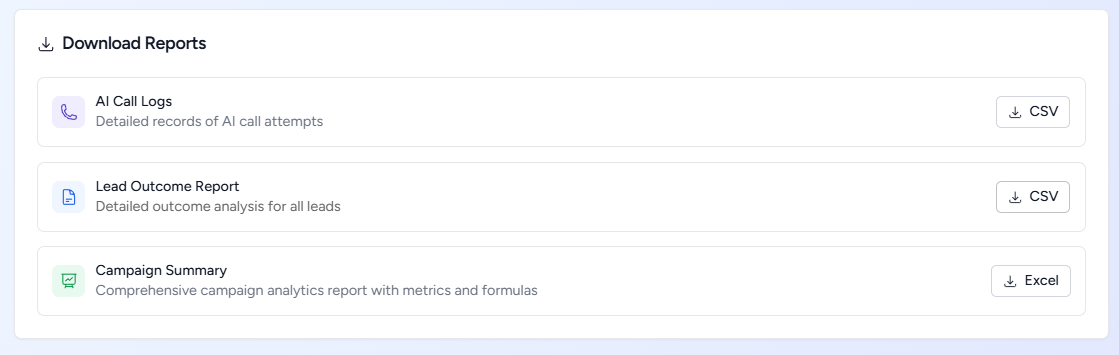
3. Spend: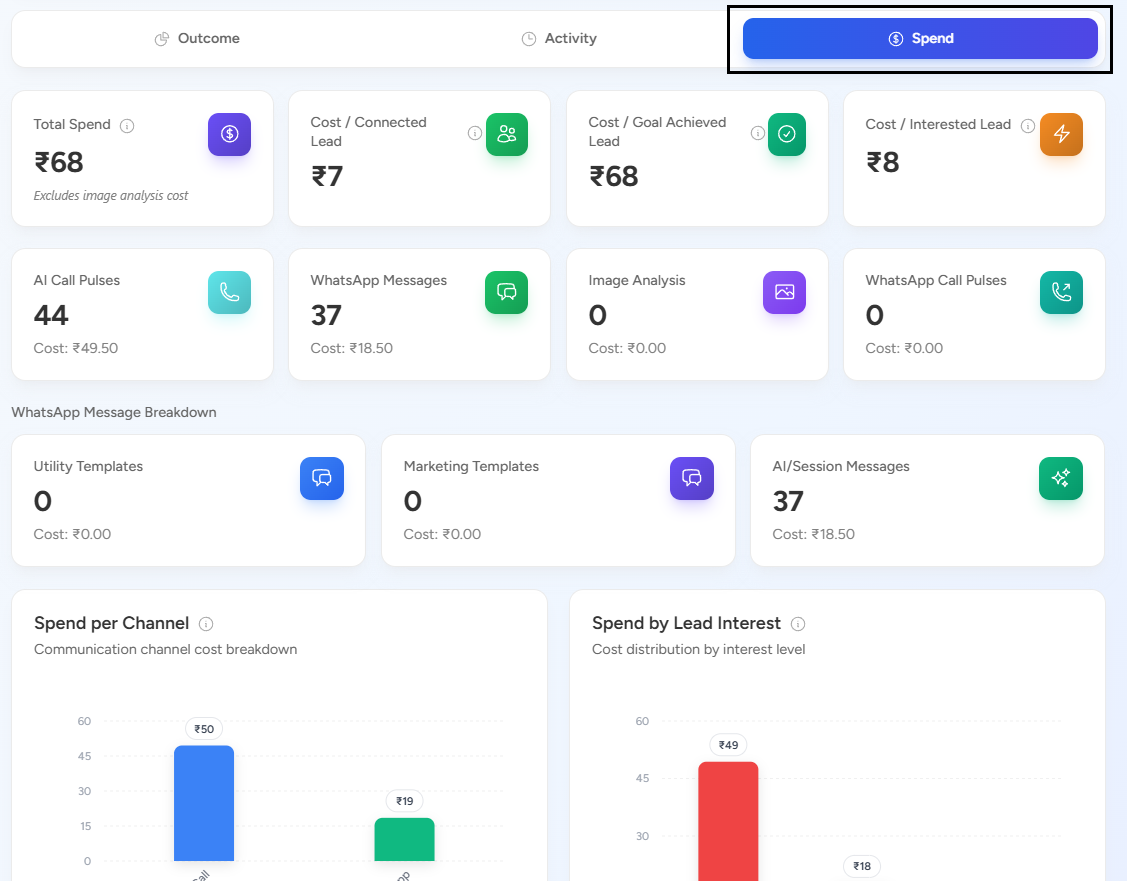
This section provides cost and spend-related insights:
- Total Spend
- Cost per Connected Lead
- Cost per Goal Achieved Lead
- Cost per Interested Lead
- Spend per Channel
- Spend by Lead Interest
- Spend Timeline
Additional detailed metrics are also available, and you can download reports from this section.
📩 Still need help? Contact our support team at [email protected] —we’re happy to assist!
Good day!