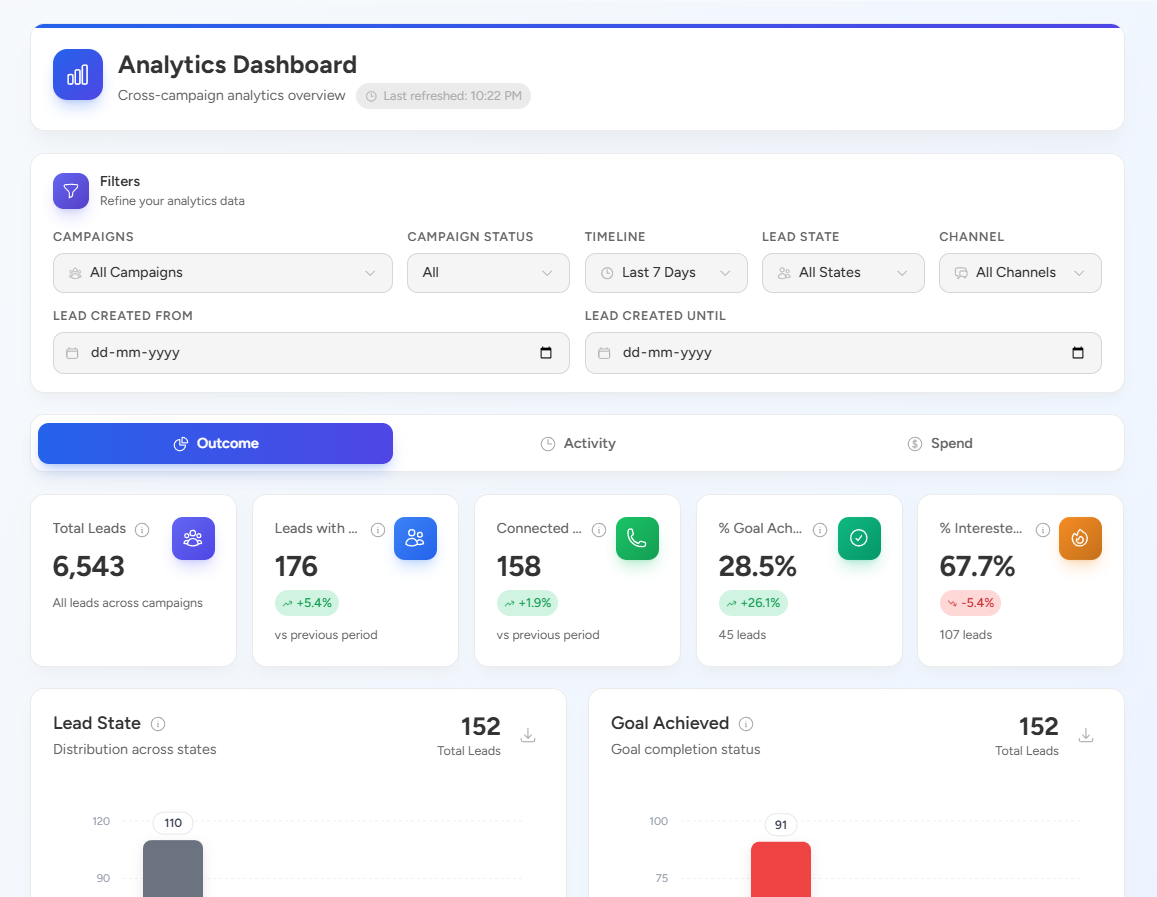
The Analytics Dashboard in Convin provides a centralized view of campaign performance and lead activity. It enables users to quickly monitor key metrics, track outcomes, and gain insights into overall operations across campaigns.
Steps to navigate Analytics Dashboard:
- Navigate to the Analytics page.
- Over view of the Analytics Dashboard:
Key Highlights
- Cross-Campaign Visibility:
View consolidated data across all campaigns in one place for better decision-making. - Customizable Filters:
Refine data using filters such as Campaigns, Campaign Status, Timeline, Lead State, Channel, and date range.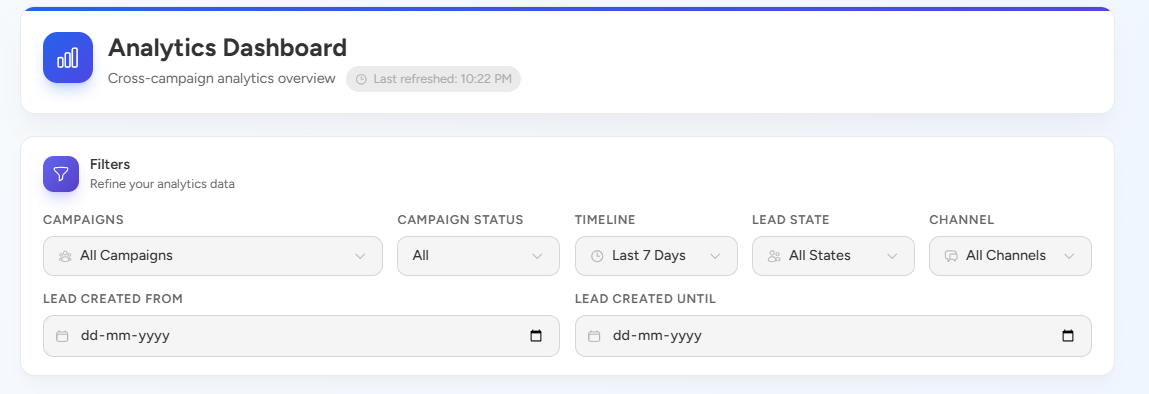
- Outcome Metrics:
Get a quick snapshot of important KPIs like:- Total Leads
- Leads with activity
- Connected calls
- Goal achievement percentage
- Interested leads percentage
- Real-Time Updates:
The dashboard reflects the latest available data, helping teams stay up to date with ongoing performance.
Purpose
- Monitor campaign effectiveness
- Track lead progress and engagement
- Identify trends and areas of improvement
- Make data-driven decisions quickly
Additional Feature
- Download Reports:
Reports can be downloaded for further analysis and sharing by scrolling down.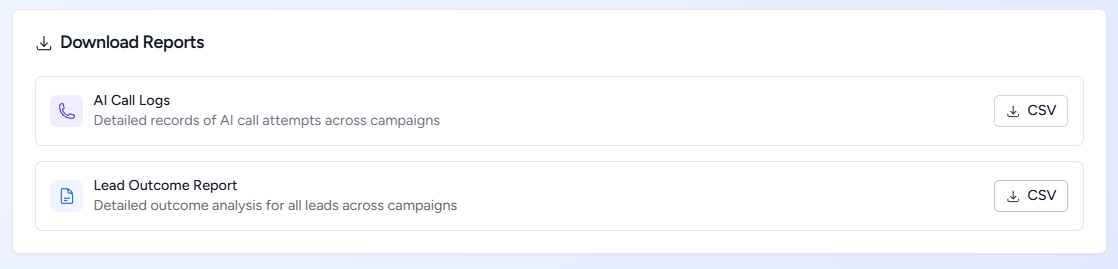
📩 Still need help? Contact our support team at [email protected] —we’re happy to assist!
Good day!