This article provides a detailed understanding of the Analytics Dashboard in Convin Sense, including its key sections such as Filters, Outcome, Activity, and Spend. It also explains important metrics like Lead State, Goal Achievement, Lead Qualification, Lead Interest, and Custom Metrics. By exploring these sections, users can effectively analyze campaign performance, track engagement, monitor costs, and download reports for deeper insights and decision-making.
How to Navigate to the Analytics Dashboard
- Navigate to the Analytics Dashboard.
- The dashboard will open with a consolidated view of campaign analytics across all campaigns.
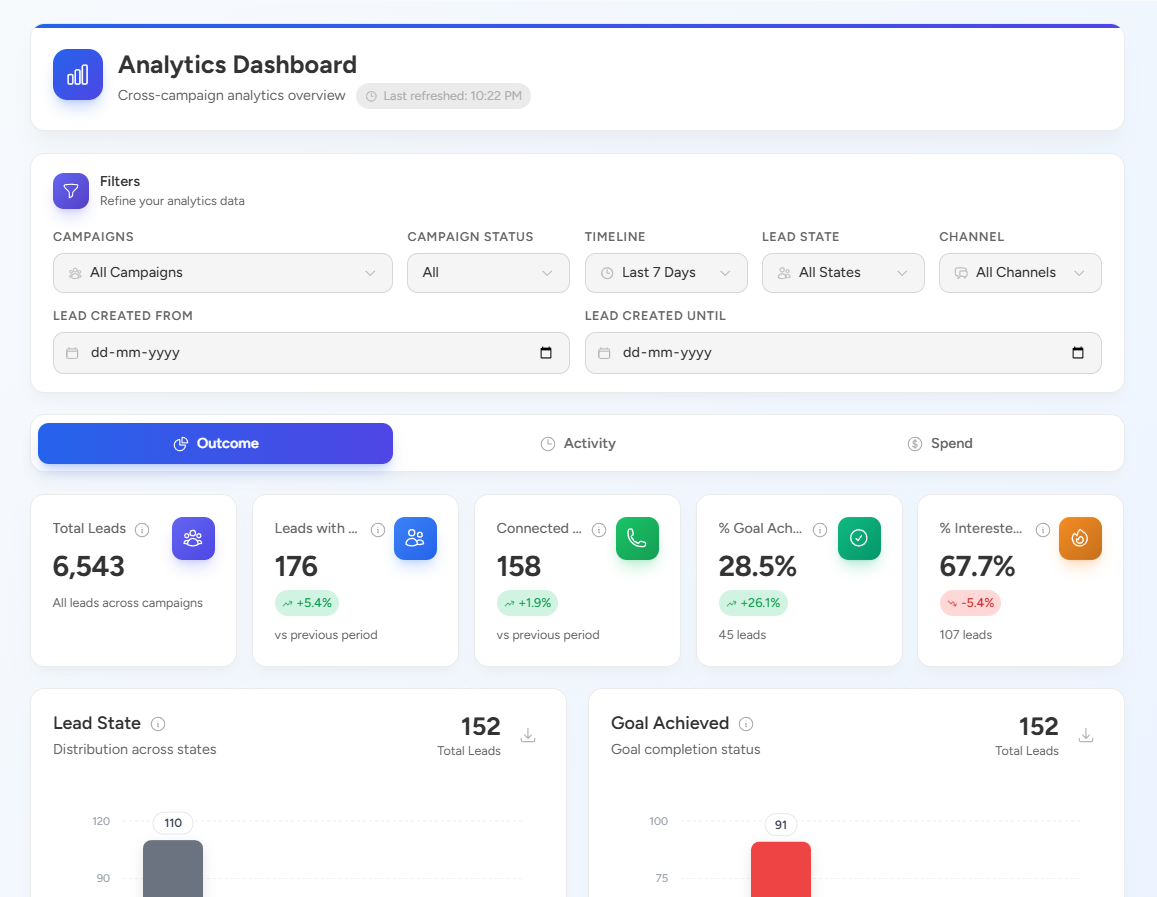
1. Filters The Filters section allows you to refine and customize the analytics data based on your requirements. You can filter data using parameters such as:
- Campaigns
- Campaign Status
- Timeline
- Lead State
- Channel
- Lead Created Date Range
Applying filters helps in analyzing specific datasets and gaining more relevant insights.
2. Outcome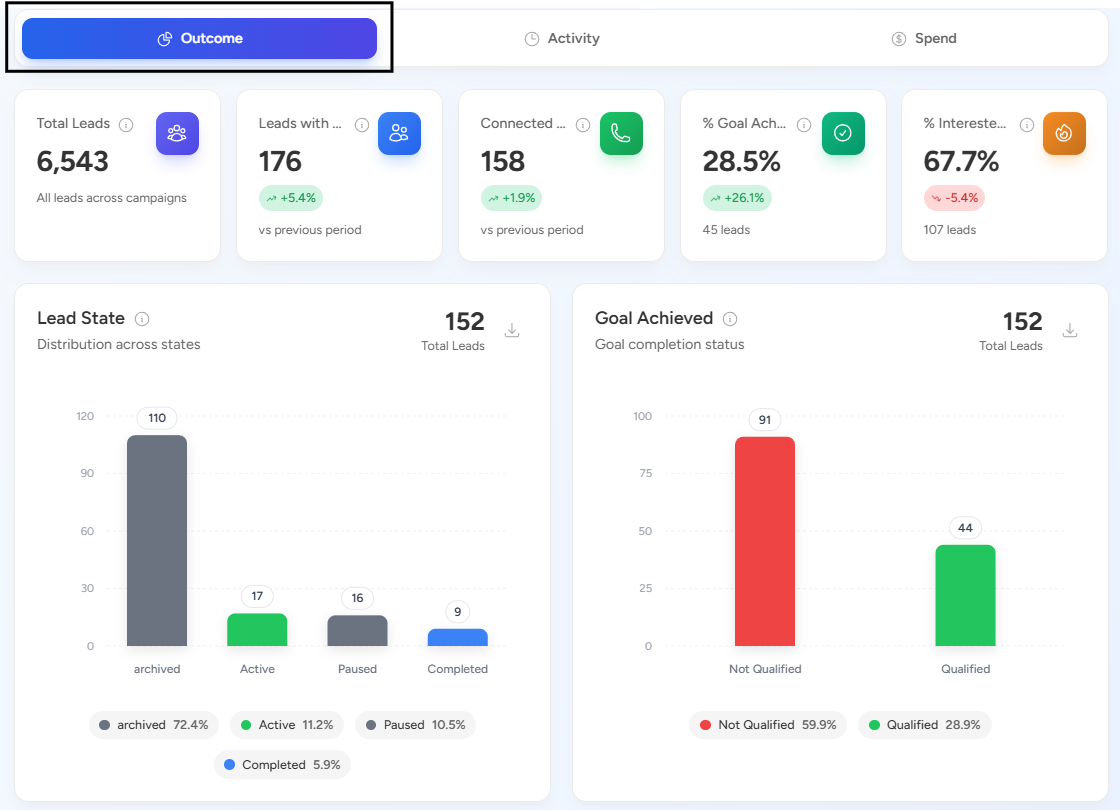
The Outcome section provides a summary of lead performance and campaign results. It includes key metrics such as:
- Total Leads – Total number of leads generated across campaigns
- Lead State – Distribution of leads across different states
- Goal Achieved – Number of leads that completed the defined goal
- Lead Qualification Status – Classification of leads based on qualification criteria
- Lead Interest Status – Indicates the level of interest shown by leads
- Custom Metrics – Displays the distribution of custom metrics across connected leads
This section helps in understanding how effectively campaigns are performing.
3. Activity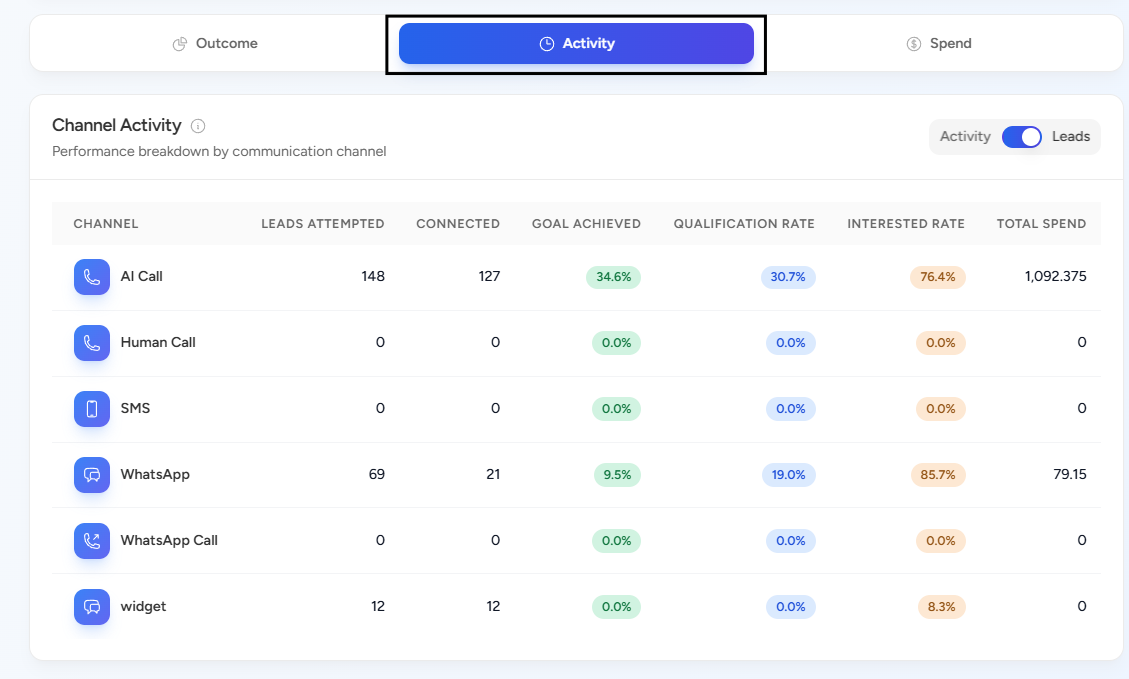
The Activity section provides insights into engagement and communication patterns. It includes:
- Channel-wise activity
- AI call activity
- Best time to connect (weekly trends)
- WhatsApp interaction analytics
This section helps identify how leads are interacting with campaigns and which channels are performing best.
4. Spend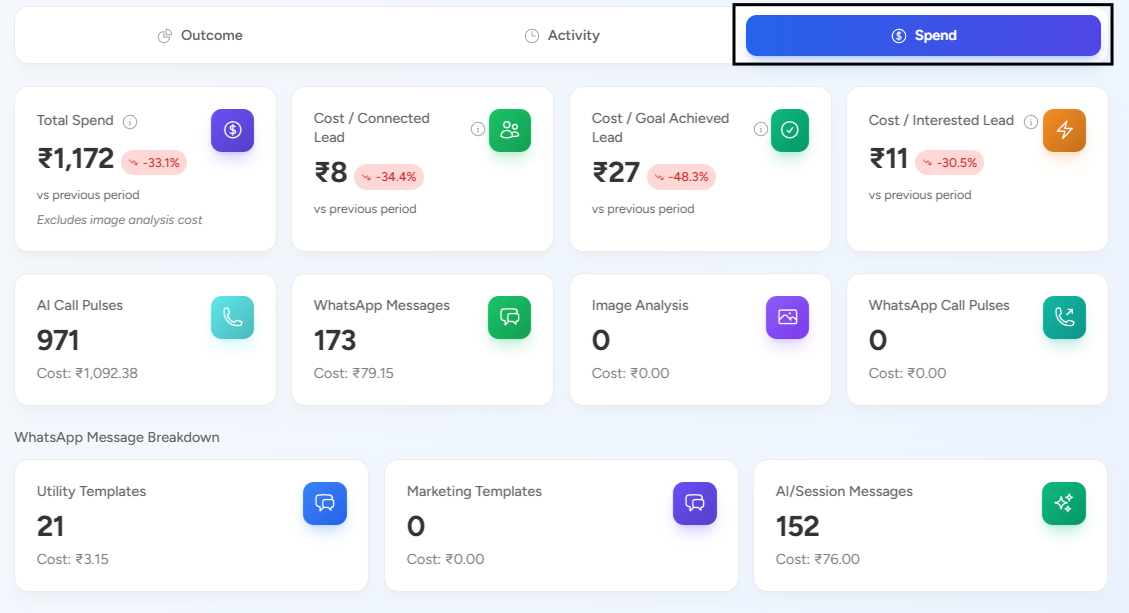
The Spend section provides detailed information about campaign costs and efficiency. It includes:
- Total Spend
- Cost per Connected Lead
- Cost per Goal Achieved Lead
- Cost per Interested Lead
- Spend per Channel
- Spend distribution based on lead interest
- Spend timeline
This section helps in tracking budget utilization and evaluating cost-effectiveness.
5. Download Report Section
Across different sections of the Analytics Dashboard, you have the option to download reports.
By scrolling down, you can access the download option to export data for further analysis and sharing.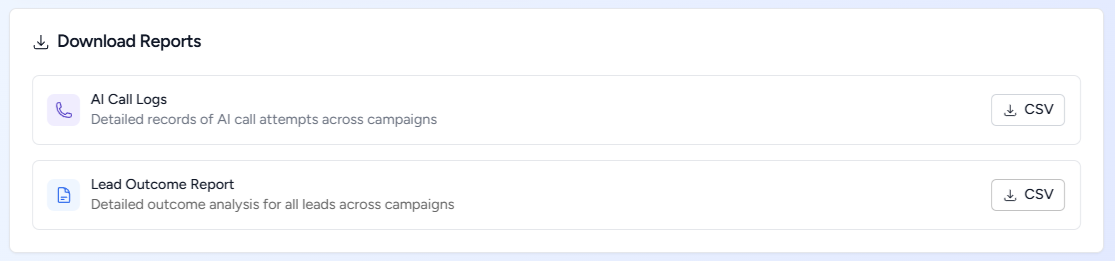
📩 Still need help? Contact our support team at [email protected] —we’re happy to assist!
Good day!